Trading and ecommerce · 5,000 styles or more · Nothing formal
What a trader gets out of Coord
The market picture gets assembled when somebody has the time, which means late or not at all. Coord runs it as a standing job, so the answer is waiting whether or not anyone went to find it.
At this size sampling is the same as not knowing. A subset checked on a schedule measures the schedule.
This morning
What changed overnight, already read and already sorted.
- Today
- Price checks run on a sample, on a schedule, on whatever the spreadsheet still points at
- With Coord
- Every SKU in the set, every day, matched to the thing you actually sell
This week
If your week looks like most trading weeks, some of this is on it
- What moved this week, and what caused it?
- What is out of stock that is costing me sales right now?
How you ask it
In the words you would have used anyway
What moved this week, and what caused it?
AskAsked in the words your team already uses. Coord exposes its tools over MCP, so a competitive set is queryable from the assistant you have open rather than from one more dashboard nobody remembers to check.
And the rest of it
Most of what lands on your desk was decided at somebody else’s
Everything that moved this morning
7
- MarketA rival dropped 42 SKUs overnight, mid sizes already gone
- MerchAvailability below 80% on eight bestsellers
- BuyingRepeat order placed on the ribbed knit, lands week 6
- MarketCompetitor now cited by three AI assistants on your top query
- DesignSampling delayed on two spring styles
- PlanningHindsight pack circulated for autumn
- SystemsCheckout A/B test concludes Thursday
Decisions taken at other desks reach you the same way market moves do, because to you they are the same kind of event. Coord scores what touches the calls this role owns and leaves the rest quiet. It reads what your team publishes and connects, never their conversations.
What Coord answers
And the observation behind each one
Every price move in your competitive set, the morning it lands
The daily panel, with depth and duration recorded, so a weekend promotion is distinguishable from a five week problem
Which of those moves is worth answering
Stock state read at variant level, so a cut on a line that had already sold through is not mistaken for one that mattered
Where attention is going before the sales follow
Search demand and AI shelf visibility, so a competitor climbing is separable from a competitor buying reach
Read to answer one question
10,000+
- 10,000+
- fashion brands tracked
- 30m+
- product SKUs
- 345m
- price and stock checks
- 5.4bn
- searches measured, back to 2018
The read is the whole catalogue. The answer is the handful of brands you actually compete with, chosen with you rather than by category, which is why it can be a sentence instead of a report. Fourteen is drawn for illustration; a real set is whatever size yours turns out to be.
About 480 brands read every day across Great Britain, the United States and France, with wider sweeps out to about 5,700. Measured September 2026.
What it reads
Your systems on one side, the market on the other
What you run
- Range.xlsx
- Shopify
- Inbox
- Competitors
- Notes
 Shopify
 Stripe
 Xero
Xero Google Sheets
 Klaviyo
 Mailchimp
 Instagram
 WhatsApp
 Slack
Slack QuickBooks
22 toolkits connect through the platform’s own authorisation, with nothing to build on your side.
What the market did
- Prices, by size and colour
- What landed and what went
- Stock depth and sell-through
- Search demand, by term
About 480 brands read every day across Great Britain, the United States and France, with wider sweeps out to about 5,700.
One answer, with your own numbers on one side of it and the market on the other.
Built for garments, not for retail in general
The reads that are ours, and where each one has got to
Garment classification
Rolling outLens reads the photograph rather than the product title: silhouette, neckline, sleeve, length, weave and finish, so two ranges filed under different words become comparable.
Colour, corrected for the shot
Rolling outShade measured off the garment itself and normalised for how the picture was lit, so ecru, oatmeal and sand stop being three colours and the same shade counts as the same shade wherever it is sold.
Size and stock depth
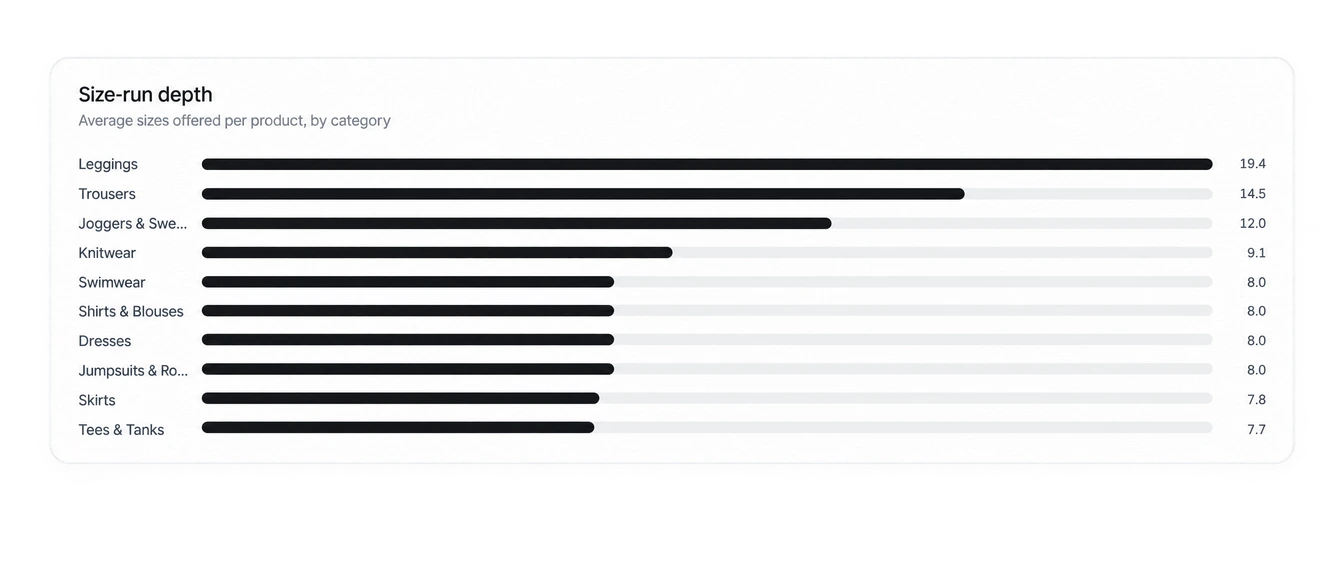
LiveEvery variant checked, so a size run that has broken in the middle is visible while it is still worth acting on rather than at the end of the season.
Price architecture
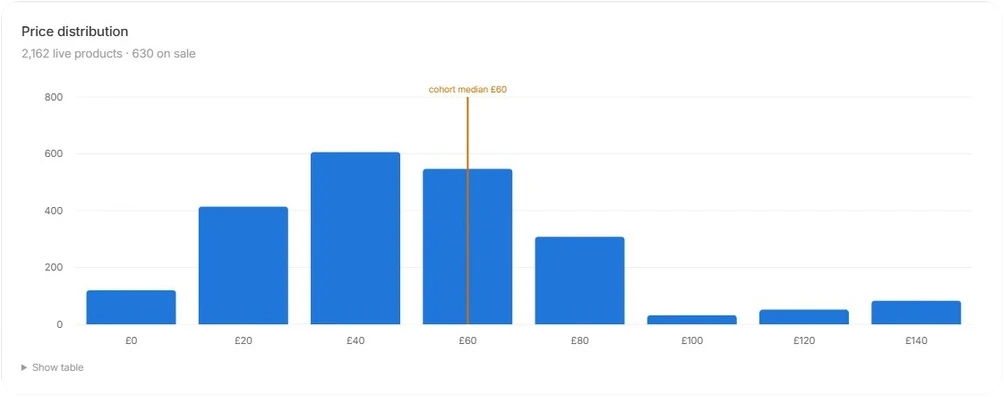
LiveEntry, median and premium by category, and how far the ladder actually runs, read off the panel rather than off a headline discount.
Demand, not just supply
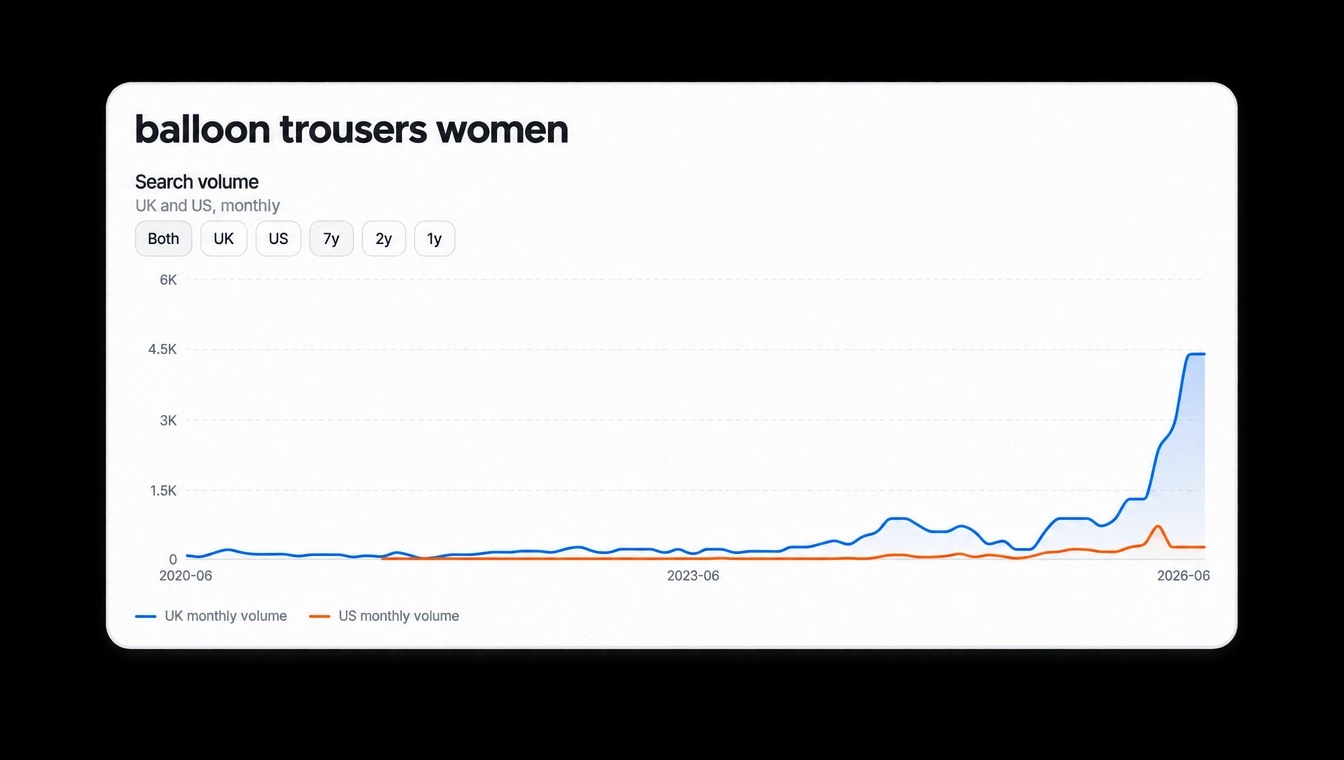
LiveSearch volume by term across four markets and back to 2018, so a shape that is rising can be told apart from one a competitor has simply bought a lot of.
What it will not tell you
Coord sees the move and the stock behind it, not the reason for it. Margin, intent and whatever was said in their trade meeting are not observable, so the cause is your read on our evidence.